
Get a central view of portfolio performance
See how your complex portfolio is performing without rebuilding spreadsheets every quarter
Get a central view of portfolio performance
See how your complex portfolio is performing without rebuilding spreadsheets every quarter


The difference
Banyan
makes
How teams operate before and after replacing disparate data sources with a dynamic software layer
Without Banyan
Pulling financials and production data from spreadsheets
Bloated Excel reports that turn fragile and crash-prone as portfolios grow
Teams find out about underperforming assets too late
With Banyan
Integrations and data mapping that ingest data for you
Custom dashboards that automatically update as data is refreshed
KPI dashboard and alerts escalate when project performance is off-track
Built for complex ownership structures
Model the full structure of your complex portfolio, from project SPVs and HoldCos to Class A/Class B entities, sponsors, investors, credit transferees, and more:
Track cash distributions, tax-credit allocations, and §6418 transfer proceeds without rebuilding spreadsheets each quarter
Manage stakeholder reporting from a single system with native investor, sponsor, and transferee support
Measure portfolio performance with the metrics that matter to you, across financial, asset performance, and impact categories
All entities
Portfolio
My dashboard
Overview
Risk summary
Analytics
Entities
EBITDA actual
EBITDA forecast
Variance
Feb
Mar
Apr
May
Jun
Jan
0
$4k
$8k
$12k
$16k
$20k
$24k
EBITDA
DSCR
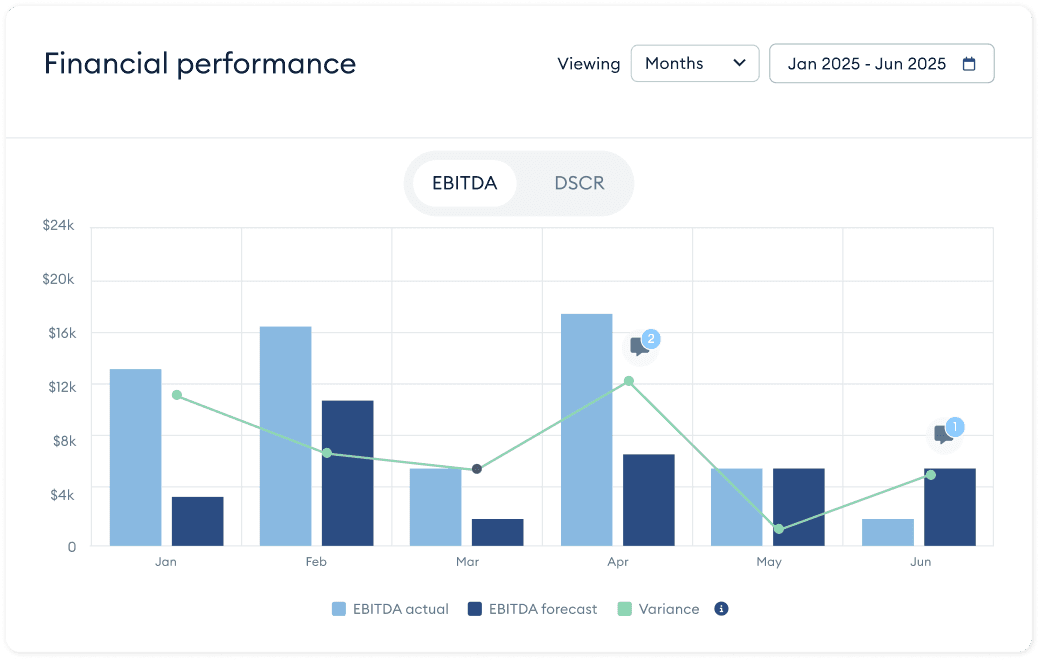
Financial performance
Viewing
Months
Jan 2025 - Jun 2025
+ Comments
Variance on Nov 2025
0.12% variance
-$1,743,919,24
2
1
Advanced portfolio reporting
Understand portfolio performance and maximize profitability with:
Custom dashboards that allow you to automate investor and board reports, track performance against plan, identify underperforming assets, prepare for month-end close, and more
Standardized reporting that provides a shared source of truth across your organization
Ability to easily roll up or drill into your portfolio data, from the fund view down to individual projects
KPI monitoring and risk management
Automate your reporting and compliance obligations at scale with an auditable system of record
Always-on monitoring and alerts for performance and unmet KPI thresholds
Leave comments and notes on portfolio performance to keep tabs on trends
Make faster decisions and reduce risk with a centralized view of your portfolio performance
Monitor
portfolio performance
See Banyan in action. Book a demo and we'll tailor the walkthrough to how your portfolio and deals are structured
Monitor
portfolio performance
See Banyan in action. Book a demo and we'll tailor the walkthrough to how your portfolio and deals are structured